Statistical Data
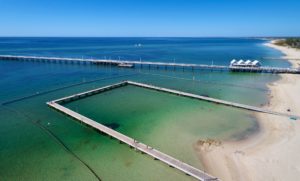
When telling the story of the South West, it’s easy to show pictures of stunning landscapes, thriving workplaces and people enjoying the lifestyle opportunities available to
people in the region.
But statistics show that there is a lot to be gained from going beyond the surface and taking a look at the region from a statistical point of view.
Browse through these statistics and gain valuable insight into the state of the region, using hard data
to highlight key areas of interest.
You will discover a region that enjoys a diverse economy and strong population growth.
Regional exports by industry sector
| Industry Sector | South West Region (2019 Release 1) | |
| $M | % | |
| Manufacturing | $4,525.756 | 39.98% |
| Mining | $2,413.667 | 21.32% |
| Agriculture, Forestry & Fishing | $1,226.677 | 10.84% |
| Construction | $857.092 | 7.57% |
| Electricity, Gas, Water & Waste Services | $686.866 | 6.07% |
| Accommodation & Food Services | $421.751 | 3.73% |
| Education & Training | $317.528 | 2.81% |
| Rental, Hiring & Real Estate Services | $194.510 | 1.72% |
| Retail Trade | $171.541 | 1.52% |
| Transport, Postal & Warehousing | $153.973 | 1.36% |
| Wholesale Trade | $74.151 | 0.66% |
| Administrative & Support Services | $73.206 | 0.65% |
| Arts & Recreation Services | $45.737 | 0.40% |
| Other Services | $36.959 | 0.33% |
| Professional, Scientific & Technical Services | $32.177 | 0.28% |
| Health Care & Social Assistance | $28.883 | 0.26% |
| Information Media & Telecommunications | $23.429 | 0.21% |
| Public Administration & Safety | $18.517 | 0.16% |
| Financial & Insurance Services | $16.624 | 0.15% |
| Total | $11,319.043 | 100.00% |
Employment by Industry Sector


Key Stats
Population: 179,791
Gross Regional Product: $14.7b
Tagged Investment
